Key Takeaways
Mutual fund ratios help investors look beyond returns to assess risk, cost, and consistency. Using metrics like Expense Ratio, Sharpe, Alpha, and Beta enables better fund comparison, smarter decisions, and stable long-term wealth creation with reduced surprises.
When you invest in mutual funds, returns are important- but ratios are useful indicators among several factors. Two mutual funds may show similar returns, yet one could be far riskier, more expensive, or poorly managed than the other. This is where mutual fund ratios come into play.
In this blog, we’ll explain the most important mutual fund ratios, their formulas, and simple Indian examples so that investors can make more informed comparisons.
Why Mutual Fund Ratios Matter
Mutual fund ratios are important to evaluate:
- How much risk the fund took
- How consistent the performance was
- How expensive the fund is
- Whether the fund beat the market skilfully or luckily
Mutual fund ratios help you:
- Compare funds within the same category
- Measure risk-adjusted performance
- Identify efficient fund managers
- Understanding cost structures
Ratios could be considered as a health report of a mutual fund
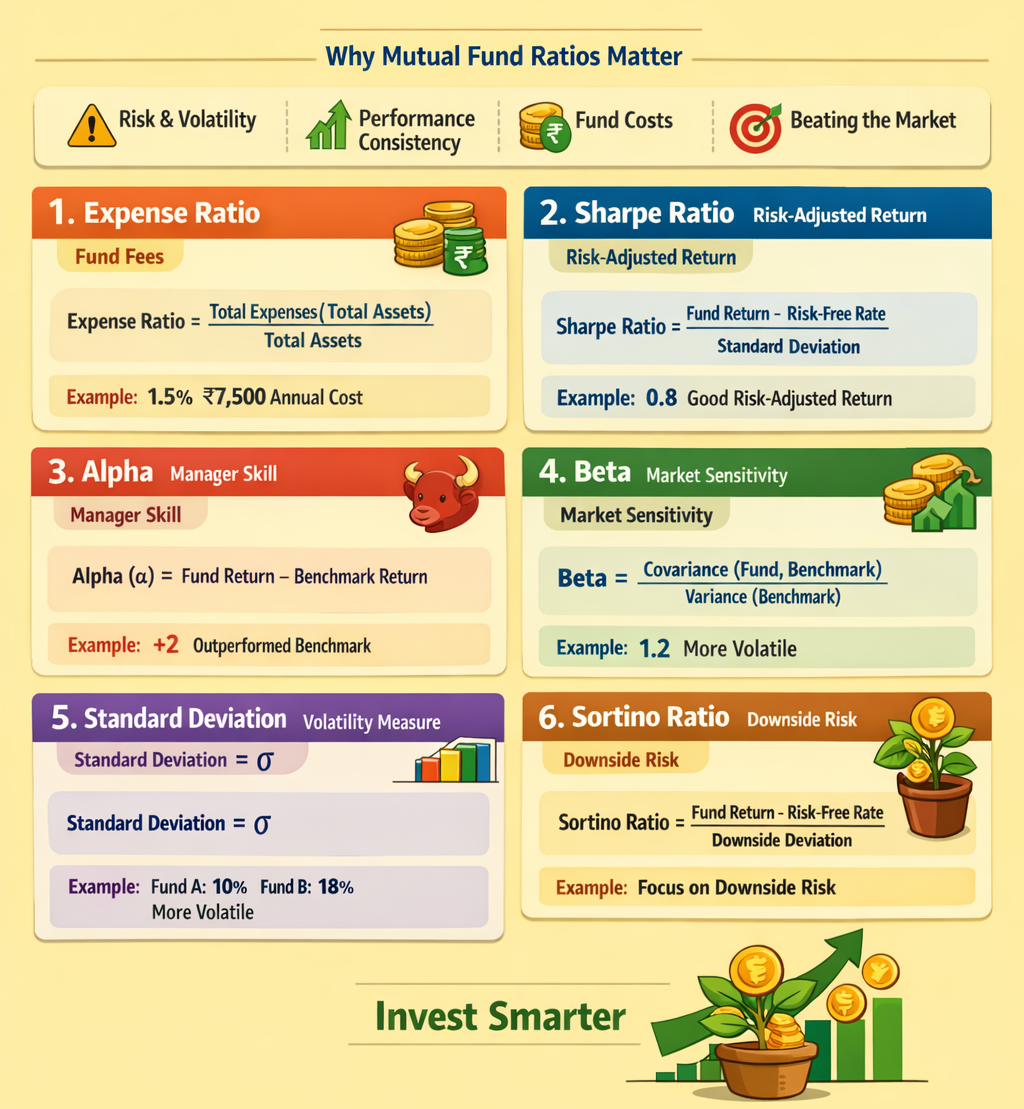
1. Expense Ratio – The Cost of Owning a Mutual Fund
The Expense Ratio shows how much the fund charges you annually to manage your money, including:
- Fund management fees
- Administrative costs
- Marketing and distribution expenses
Expense Ratio Formula
Expense Ratio = (Total Annual Fund Operating Expenses / Average Assets Under Management) x 100
Example:
- Expense Ratio: 1.5%
- Investment: ₹5,00,000
Annual cost = ₹7,500 (deducted indirectly)
- Higher expense ratios reduce your net returns, especially over the long term.
2. Sharpe Ratio- Return for the Risk Taken
The Sharpe ratio measures how much return a fund generates for each unit of risk taken.
Sharpe Ratio Formula
Sharpe Ratio = (Portfolio Return – Risk-Free Return) / Standard Deviation
Example:
- Fund Return: 14%
- Risk-Free Rate (FD): 6%
- Standard Deviation: 10
Sharpe Ratio = 0.8
- A higher Sharpe Ratio may indicate better risk-adjusted performance (within the same category)
*Examples are illustrative and based on assumed values for explanation purposes only.
3. Alpha- Fund Manager’s Skill
Alpha shows how much extra return a fund generated compared to its benchmark.
Alpha Formula
Alpha (α) = Fund Return – Expected Return (Benchmark)
Example:
- Benchmark return: 12%
- Fund return: 14%
Alpha = +2
- Positive Alpha → Fund manager added value
- Negative Alpha → Underperformance
*Examples are illustrative and based on assumed values for explanation purposes only.
4. Beta – Sensitivity to Market Movements
Beta measures how sensitive a fund is to market movements.
Beta Formula
Beta (β)= Covariance (Fund returns, Benchmark returns) / Variance (Benchmark returns)
Beta Interpretation
- Beta = 1 → Moves like the market
- Beta > 1 → More volatile than market
- Beta < 1 → Less volatile than market
Example:
Beta = 1.2
If the market falls 10%, the fund may fall ~12%.
5. Standard Deviation – Volatility Indicator
It measures how much a fund’s returns fluctuate over time.
Standard Deviation Formula
s = √( Σ (X − X̄)2 / (n − 1) )
Example:
- Fund A: Std Dev 10
- Fund B: Std Dev 18
Fund B is more volatile in this scenario.
- Higher deviation = more volatility
6. Sortino Ratio – Downside Risk Measurement
The Sortino ratio focuses only on negative volatility, unlike Sharpe which considers total volatility.
Sortino Ratio Formula
Sortino Ratio = (Fund Return – Risk-Free Rate) / (Downside Deviation)
It’s more relevant for investors who care about:
- Capital protection
- Downside risk
How to Use Mutual Fund Ratios the Right Way
- Compare funds within the same category.
- Don’t rely on one ratio alone.
- Align ratios with your investment goal & horizon.
- Review ratios annually, not daily.
Final Thought: Ratios Turn You Into a Smarter Investor
You don’t need to be a finance expert to invest wisely. Once you understand these key concepts of mutual fund investment calculation, you move from guesswork investing to data-driven investing, while getting support for better long-term decision-making. The good news is that Inbest is there to assist you in making informed financial decisions based on your goals and risk profile.
Disclaimer
Mutual fund investments are subject to market risks. Please read all scheme-related documents carefully before investing. SIP estimates and all comparison figures mentioned are purely illustrative. Past performance is not indicative of future results. Baid Inbest LLP is an AMFI-registered Mutual Fund Distributor (ARN: 86114). This content is for educational purposes only and does not constitute personalised investment advice. Please consult a SEBI-registered investment advisor before making investment decisions.


